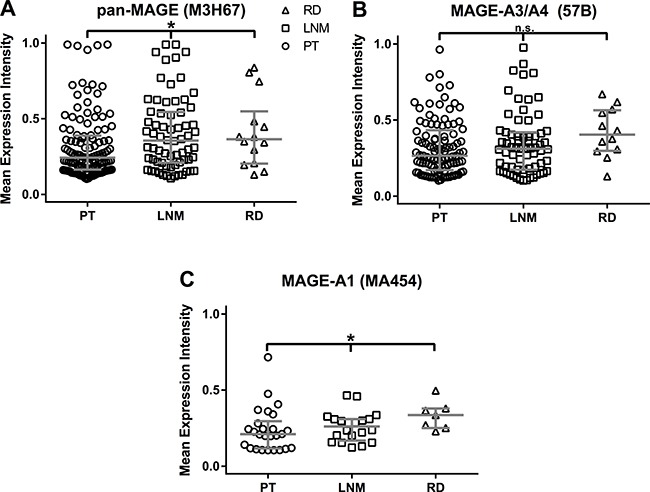
Figure 2. Mean Expression Intensities (MEI) in samples of primary tumors (P), lymph node metastases (LNM) and recurrenct disease (RD).

All available samples with a MEI ≥ 0.1 were included in this analysis. MEI values are shown for each triplicate. The horizontal bar indicates the median MEI, the vertical bars indicate the interquartile range. Median MEI were as follows: Pan-MAGE: P = 0.24 (n = 120), L = 0.36 (n = 68), R = 0.37 (n = 14). MAGE-A3/A4: P = 0.27 (n = 101), L = 0.31 (n = 67), R = 0.40 (n = 12). MAGE-A1: P = 0.21 (n = 26), L = 0.26 (n = 20), R = 0.33 (n = 7). By Kruskal Wallis test the median MEI were different for pan-MAGE (p = 0.018) and MAGE-A1 (p = 0.041), but did not reach significance for MAGE-A3/A4 (p = 0.111).
