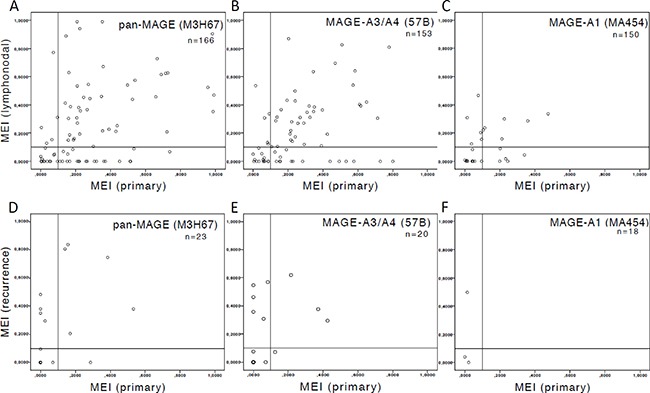
Figure 3. Scatter plot of Mean Expression Intensities (MEI) in paired samples.

The available number of samples (n) is indicated. The threshold of MEI = 0.1 for primary tumors (PT) is indicated by a vertical bar and a horizontal bar for lymph node metastases (LNM) and recurrent disease (RD) respectively. MEI was compared in related samples using Wilcoxon signed rank test. (A–C) depict MEI of paired samples of PT and LNM. The median of differences between the MEI of PT and respective LNM was not different for (A) pan-MAGE (p = 0.900), (B) MAGE-A3/A4 (p = 0.594) or (C) MAGE-A1 (p = 0.601). (D–F) depict MEI of paired samples of PT and RD. Significant differences were observed for (D) pan-MAGE (n = 23, p = 0.034), (E) MAGE-A3/A4 (n = 20, p = 0.041), but not for (F) MAGE-A1 (n = 18, p = 0.144). The number of discordant samples in the upper left quadrant (PT = negative, RD = positive; pan-MAGE: 17.4%, MAGE-A3/A4: 25%, MAGE-A1: 16.7%) is higher than in the lower right quadrant (PT = positive, RD = negative; pan-MAGE: 4.3%, MAGE-A3/A4: 5%, MAGE-A1: 0%)).
