
Figure 2. Macropinocytosis assay in colon carcinoma HT29 cells and pancreatic carcinoma MIA PaCa-2 cells.
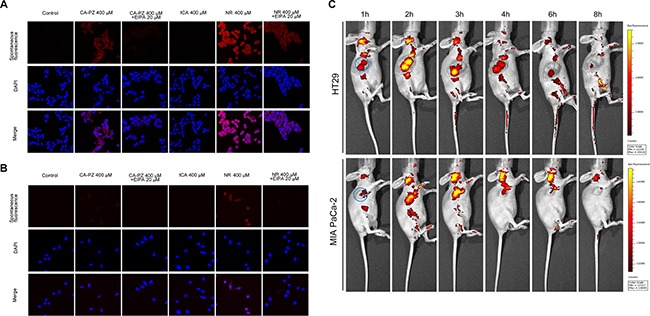
(A) Images of HT29 cells taken by confocal microscopy. As shown, the CA-PZ treated HT29 cells that displayed appreciably high level of macropinosome formation as seen by red fluorescence were similar to NR-treated cells, whereas the control group and tCA group show almost no fluorescence. In addition, the uptake was inhibited by 5-(N-ethyl-N-isopropyl) amiloride (EIPA), a relative specific inhibitor of macropinocytosis. (B) Images of MIA PaCa-2 cells taken by fluorescence microscopy. The appearance of MIA PaCa-2 cells was similar to HT29 cells. (C) In vivo optical imaging in HT29 and MIA PaCa-2 xenograft-bearing athymic mice after intravenous injection of CA-PZ. Representative in vivo fluorescence images at appointed times after tail vein injection of 1.5 mmol/kg CA-PZ. The blue circled area indicates tumor location. Color scale represents photons/s/cm2/steradian.