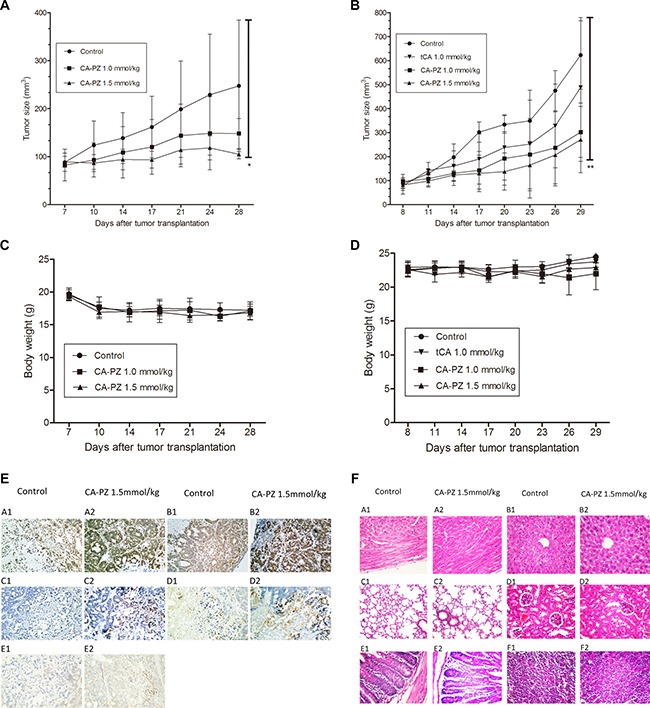
Figure 6. Anti-tumor efficacy of CA-PZ against human colon carcinoma HT29 and MIA PaCa-2 pancreatic carcinoma xenograft in athymic mice.

(A) and (B) The growth curves of MIA PaCa-2 and HT29 xenografts in different groups (n = 6) respectively are shown. Tumor volumes are measured every 3 days after treatment. As shown, CA-PZ at the tested doses suppressed the growth of tumors. Significant differences were found between the control group and the CA-PZ treated groups (*P < 0.05; **P < 0.01). (C) and (D) Body weight curves for the treated and the control animals respectively for MIA PaCa-2 and HT29 xenograft-bearing athymic mice. (E) Immunohistochemical staining of the HT29 carcinoma xenograft in CA-PZ treated group (1.5 mmol/kg) and the control group. (magnification 200×): A1 and A2, the IHC staining for Ac-H3; B1 and B2, the IHC staining for Ac-H4; C1 and C2, the IHC staining for cleaved PARP; D1 and D2, the IHC staining for cleaved caspase 3; E1 and E2, the IHC staining for Bim. (F) Histopathological appearance of various organs of the CA-PZ (1.5 mmol/kg) treated and the control xenograft-bearing mice. (H&E. staining, magnification 200×): A1 and A2, heart; B1 and B2, liver; C1 and C2, lung; D1 and D2, kidney; E1 and E2, small intestine; F1 and F2, femur bone marrow. No toxicopathological changes were found in all of the tested organs.
