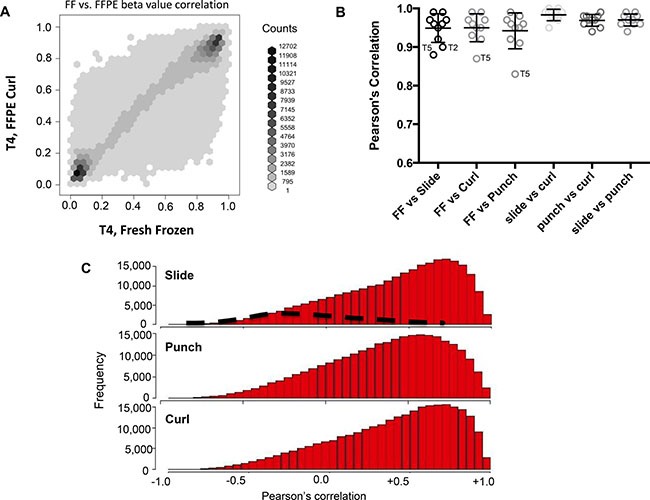
Figure 1.

(A) The correlation between FF and FFPE probe values. (B) Correlation and standard error of mean β values between FF and each type of FFPE. (C) The top, middle and bottom histograms show the distribution of ρ values from FF-FFPE correlations for all loci in slide, curl and punch respectively. The black dashed line are locus specific correlations from Jasmine et al. analysis of 10 FF and FFPE colon tumor samples using the Illumina HumanMethylation27K and a homemade ligation method.
