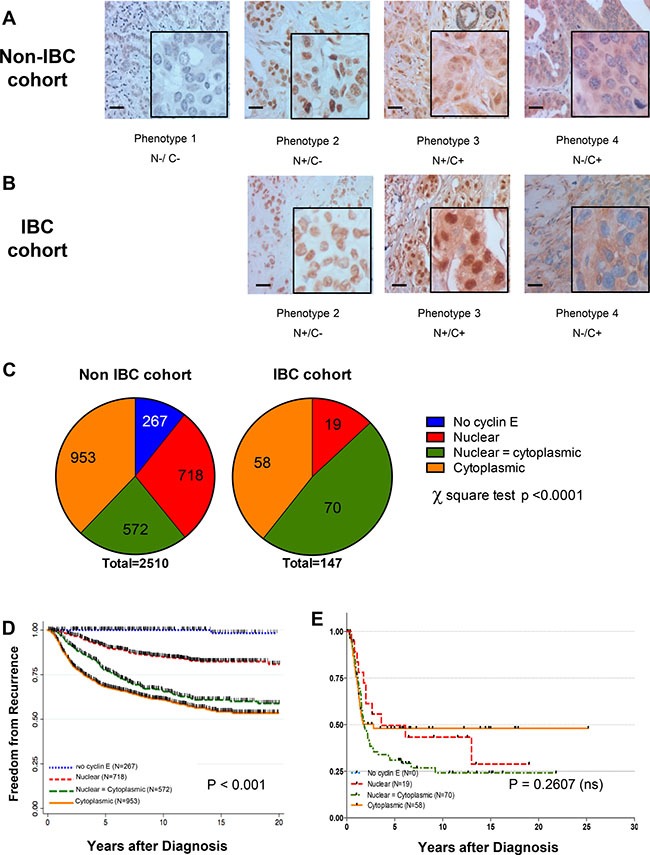
Figure 1. Cyclin E is overexpressed in IBC patient samples.

Representative immunohistochemical images showing cyclin E staining phenotypes in (A) non-IBC and (B) IBC tumors. N = nuclear staining C = cytoplasmic staining, either present (+) or absent (–) (C) Comparison of the distribution of staining phenotypes in non-IBC versus IBC cohorts. P < 0.0001, chi-squared test. (D, E) Kaplan-Meier survival plot showing the association between cyclin E staining (N and C and freedom-from-recurrence (FFR) for non-IBC cohort stratified by cyclin E phenotype regardless of hormone receptor/HER2 status. P < 0.0001. (E) Kaplan-Meier survival plot of non-IBC (D) and IBC (E) cohorts as a function of cyclin E phenotype.
