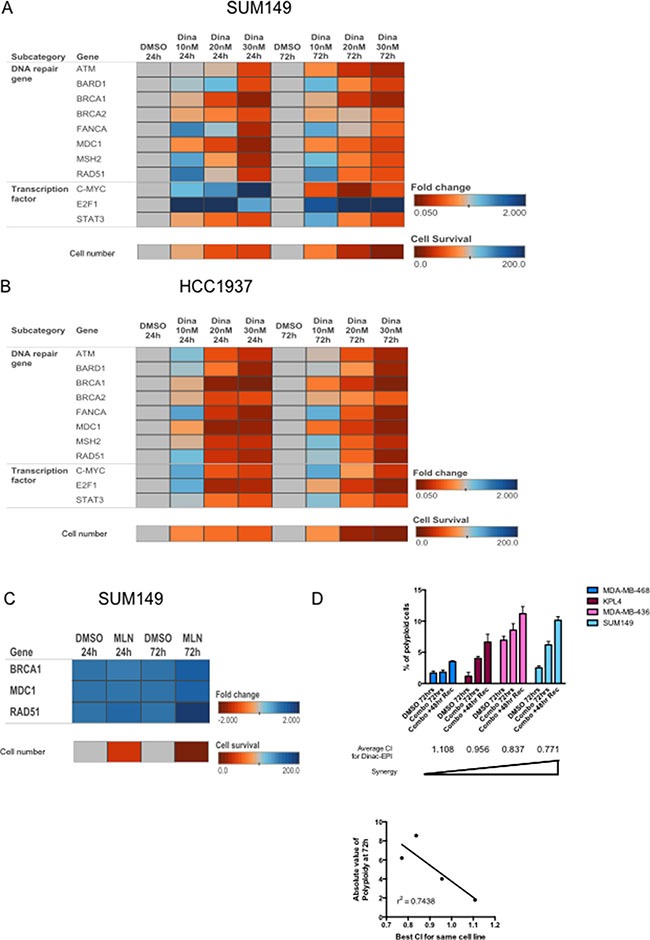
Figure 5. Dinaciclib inhibits multiple DNA repair pathways to induce synergism with DNA-damaging chemotherapy and induce polyploidy.

(A, B) Heatmap depicting fold changes for expression of the indicated genes (as measured by qRT-PCR) in SUM149 (A) or HCC1937 (B) cells treated with 10–30 nM dinaciclib for 24 or 72 hours. Fold changes were compared within each time point, compared with DMSO control. The bottom row indicates cell number (as a percentage of control) for each condition, to correlate the magnitude of change in gene expression with cytotoxicity of the drug. (C) Heatmap depicting fold changes for expression of the indicated genes (as measured by qRT-PCR) in SUM149 cells treated with 1 μM MLN8237 for 24 or 72 hours. The cell number row was calculated similarly to A. (D) Cells were treated with sequentially with dinaciclib followed by epirubicin with or without a 48 hour recovery period and subjected to polyploid DNA content by FACS analysis. SUM149 (8 nM dinaciclib and 20 nM epirubicin), KPL4 (10 nM dinaciclib and 15 nM epirubicin), MDA-MB-468 (18 nM dinaciclib and 5 nM epirubicin), and MDA-MB-436 (12.52 nM dinaciclib and 4 nM epirubicin). The average CI values for the dinaciclib-epirubicin combination are listed under each cell line bars. Bottom panel: Concordance of CI and polyploidy as depicted in the logistic regression analysis graph. Error bars represent standard deviation based on two or three independent experiments.
