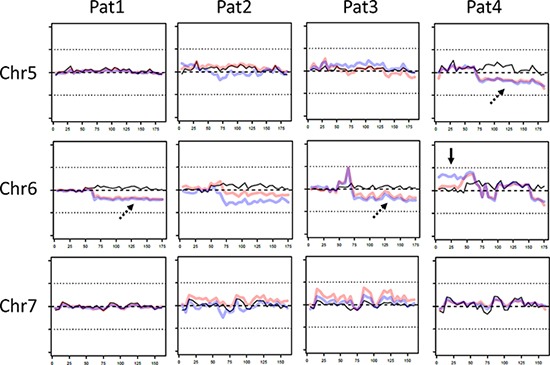
Figure 4. Representative copy number variations (CNV) on chromosomes 5-7 of patient 1-4.

Of each patient CNV of non-tumor sample (black line), central tumor sample (red line) and peripheral sample (blue line) is shown. In some fractions of the genome CNV between both tumor samples and control were observed (dotted arrow), whereas in chromosome 6 the copy numbers between both tumor samples varied. X-axis: chromosome length (megabases), y-axis: deviation from expected coverage, upper dotted line = +50%, lower dotted line = −50%.
