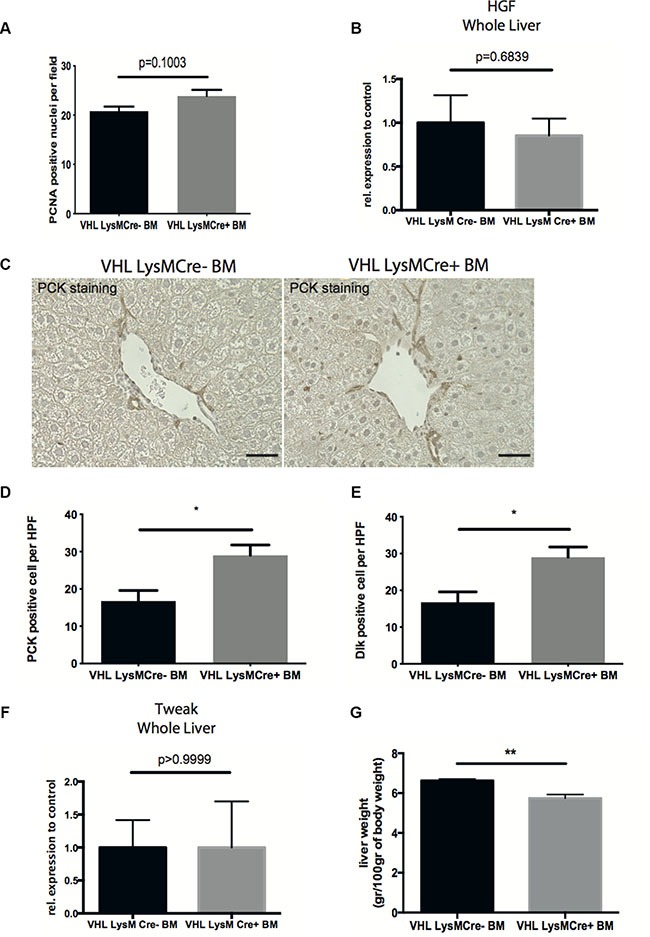
Figure 4. Deletion of VHL in myeloid cells accelerates liver regeneration.

(A) Quantification of PCNA-positive nuclei per field on liver sections. (B) Quantitative real time-analysis of HGF expression in whole livers. (C) Representative images of pan-cytokeratin (PCK) immunohistochemistry on liver sections. (D) Quantitative analysis of PCK-expressing liver progenitor cells. (E) Quantitative analysis of Dlk-expressing liver progenitor cells. (F) Quantitative real time-analysis of Tweak-expression, respectively, in whole livers. (G) Liver wet weight normalized to body weight. Error bars represent SEM (n = 5 for VHL LysMCre- and n = 7 for VHL LysMCre+). Scale bars equal 50 μm.
