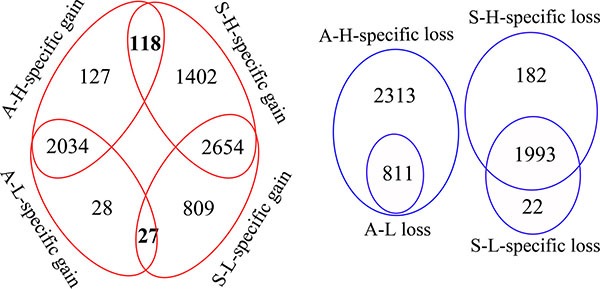
Figure 2. Diagrams indicating the overlapping genes with CNV between the distinct invasive/migratory subclones.

The red circle indicates the number of amplified genes and the blue circle indicates the number of deleted genes. The red circle demonstrates that there were 245 (117+118) genes amplified as “A-H-specific gains” and 1520 (1402+118) genes amplified as “S-H-specific gains,” with 118 genes overlapping between them. There were 55 (28+27) genes amplified as “A-L-specific gains” and 836 (809+27) genes amplified as “S-L-specific gains,” with 27 genes overlapping between them. The blue circle demonstrates that there were 2313 genes deleted as “A-H-specific losses” and 182 genes deleted as “S-H-specific losses,” as well as 22 genes deleted as “S-L-specific losses”.
