
Figure 4. Determination of NF-κB expression in Asherman syndrome rats.
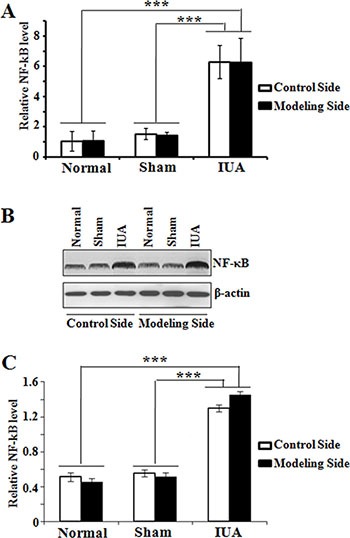
Endometrial tissues were collected both sides of the uteruses from three different rat groups. (A) quantitative RT-PCR analysis of NF-κB mRNA expression; Normal: n = 7; Sham: n = 7; IUA: n = 15. ***p = 0.001. (B) Western blotting analysis of NF-κB protein expression; (C) Quantification of NF-κB protein in B. n = 5, ***p = 0.001.