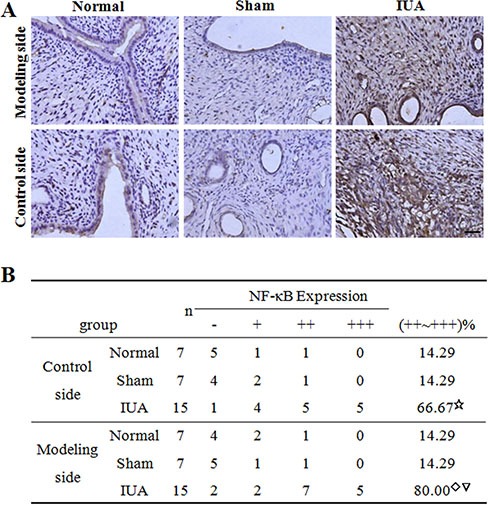
Figure 5. IHC staining of NF-κB in Asherman syndrome rats.

Endometrial tissues were collected both sides of the uteruses from three different rat groups. (A) IHC staining of NF-κB in different samples. Scale bar = 10 uM. (B) Summarization of intensity and percentage of positive staining signal in A. ☆Comparison of IUA control side to Normal, Sham control sides, F = 17.1, P = 0.02; ◇Comparison of IUA modeling side to Normal, Sham modeling sides, F = 18.3, P = 0.01; ▽Comparison between control and modeling sides in IUA group, t = 0.325, P = 0.441.
