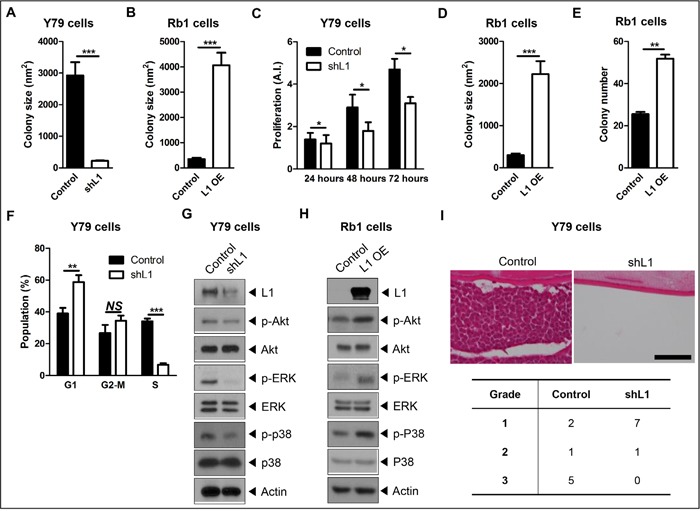
Figure 2. L1 increases adhesion-mediated proliferation of retinoblastoma.

A and B. Quantitative analyses of colony formation of control and L1-depleted Y79 cells (A) or control and L1-overexpressing SNUOT-Rb1 cells (B) at 2 days after thawing. C. The degree of proliferation of control and L1-depleted Y79 cells at indicated time points. D and E. Quantitative analyses of colony formation in soft agar in the size (D) and number (E) of colonies. F. The distribution of cell cycle of control and L1-depleted Y79 cells analyzed by flow cytometry. G and H. The expression of L1, phospho-Akt (p-Akt), Akt, phospho-ERK (p-ERK), ERK, phospho-p38 (p-p38), and p38 in control and L1-depleted Y79 cells (G) or control and L1-overexpressing SNUOT-Rb1 cells (H) on Western blot analyses. I. Representative photographs of in vivo tumor formation at 4 weeks and the proportion of tumors with grade 1, 2, and 3 after intravitreal injection of control or L1-depleted Y79 cells. Scale bar, 100 μm. Control, Y79 or SNUOT-Rb1 cells; shL1, Y79 cells transfected with L1-specific shRNA; L1 OE, SNUOT-Rb1 cells transfected with a lentiviral vector containing full length L1. Bars, SEM. *, P < 0.05; **, P < 0.01; ***, P < 0.001; NS, P > 0.05 (A-E, Mann-Whitney U-test; F, Unpaired T-test).
