
Figure 4. Invadopodia matrix degradation activity.
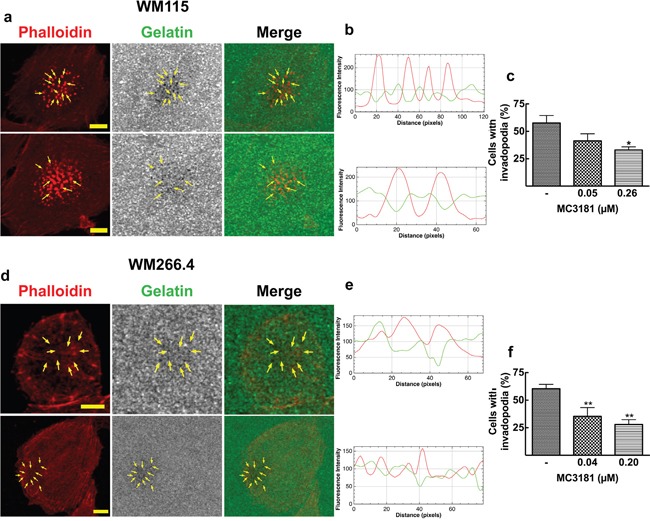
WM115 and WM266.4 cells were seeded on Fluorescein-Gelatin coated chamber slides for 5 hours, and then fixed and stained for TRITC-Phalloidin. a. WM115 and d. WM266.4 representative confocal images showing invadopodia as focal cytoplasmic concentrations of Phalloidin that overlap with areas of gelatin clearing (dark holes in the matrix) within the merged image, as indicated by arrows. Fluorescein-Gelatin images were pseudocolored in gray. Images were acquired with a 40X magnification oil immersion objective and a digital magnification 3X is shown. Scale bar = 10 μm. b. WM115 and e. WM266.4 representative fluorescence intensity plot showing co-localization of TRITC-Phalloidin (red line) and gelatin degradation (green line). Fluorescence intensity was measured at each image pixel along an arbitrary line that crossed through an invadopodia structure. Percentage of c. WM115 and f. WM266.4 cells with active invadopodia was obtained by counting approximately 100 cells in 3 fields. Data shown are means ± SD of three independent experiments. *P < 0.05 and **P < 0.005 vs control.