
Figure 1. SerpinB3, COX-2 and β-Catenin mRNA expression levels in colorectal cancer tissue.
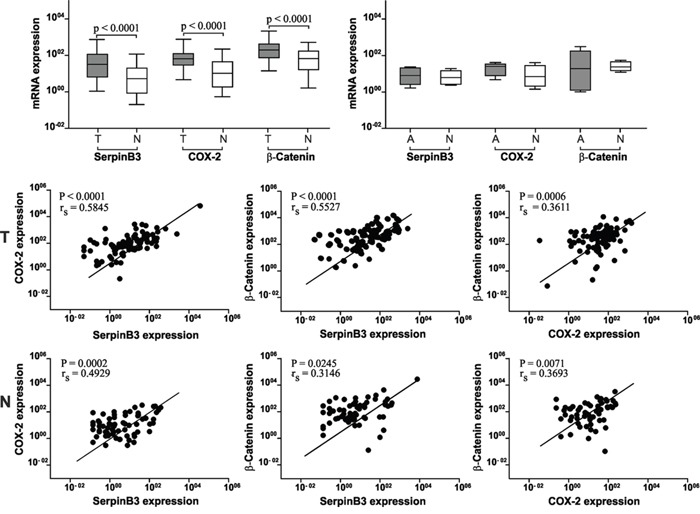
Upper panel: Expression levels of SerpinB3, COX-2 and β-Catenin are significantly higher in tumor (T) samples than in the corresponding non-tumor tissue (N). In adenoma (A) samples the levels of the three molecules are similar to the adjacent tissue (N). Results are expressed as pg/μL. Boxes and whiskers represent the 25th to 75th and 5th to 95th percentiles, respectively; the median value is represented by the central line in each box and the range of values of all samples is represented by vertical bars. Statistical analysis was carried out using Mann Whitney test. Lower panels: Correlation of mRNA levels between SerpinB3, COX-2 and β-Catenin mRNA in tumor (T) specimens and in the corresponding non tumor samples (N). rs = Sperman correlation coefficient.