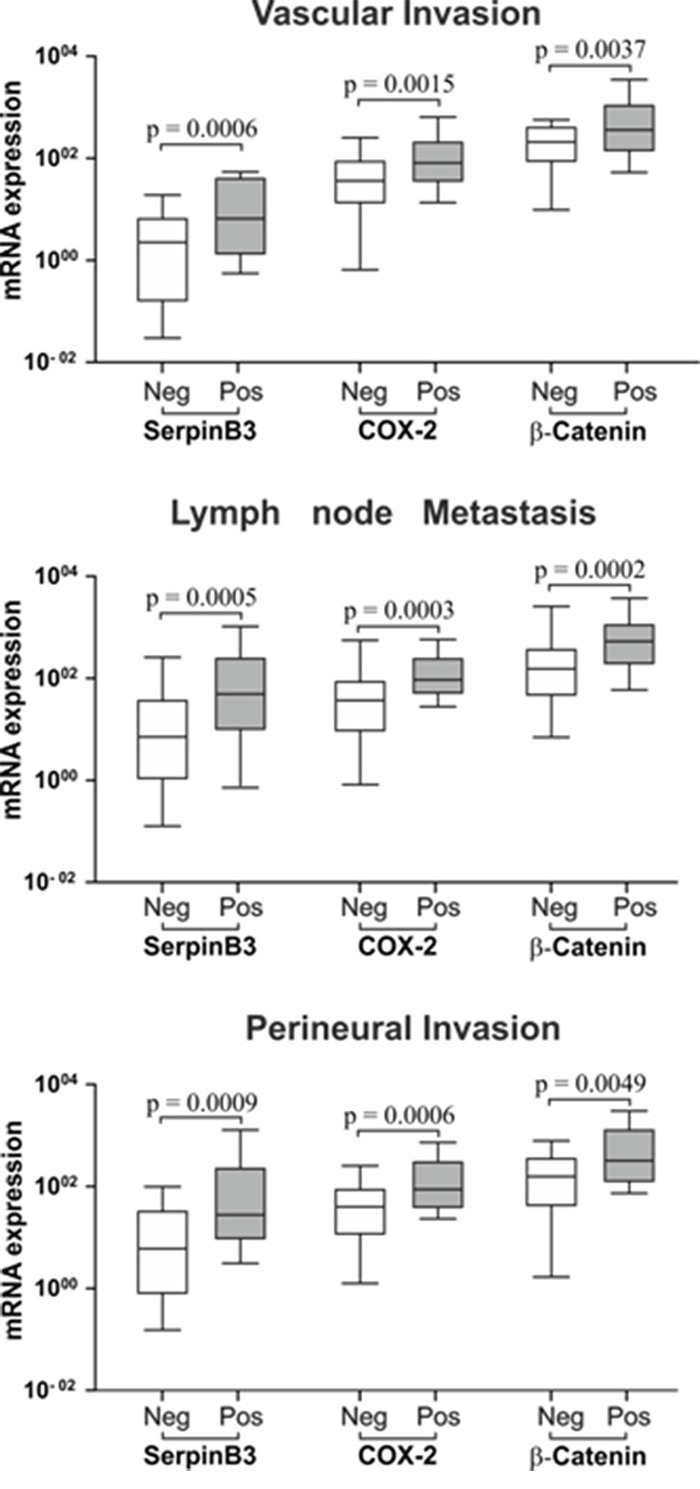
Figure 3. SerpinB3, COX-2 and β-Catenin expression in tumor specimens in relation with histological parameters of poor prognosis.

Mann-Whitney Test analysis was applied to determine statistical differences between positive versus negative groups for Vascular Invasion, lymph node metastasis and perineural invasion. Boxes and whiskers represent the 25th to 75th and 5th to 95th percentiles, respectively. The central line in each box represents the median value, the range of values of all samples is represented by vertical bar. The level of significance was set at p < 0.05. Neg = negative and Pos = positive for the pathologic parameter.
