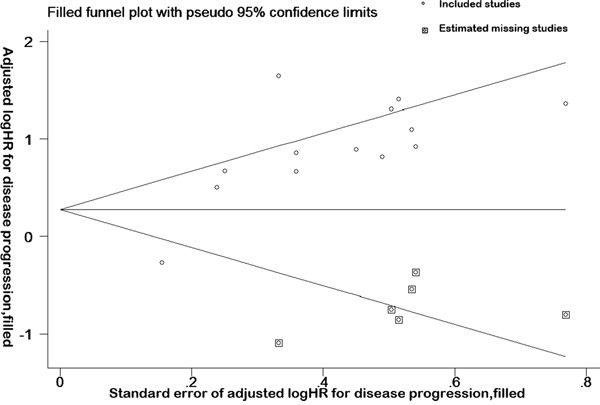
Figure 5. Trim and fill method reveals publication bias in disease progression data.

Funnel plot and complement funnel plot of the studies on disease progression. The box in this figure is a complement plot, which was used to estimated missing studies.
