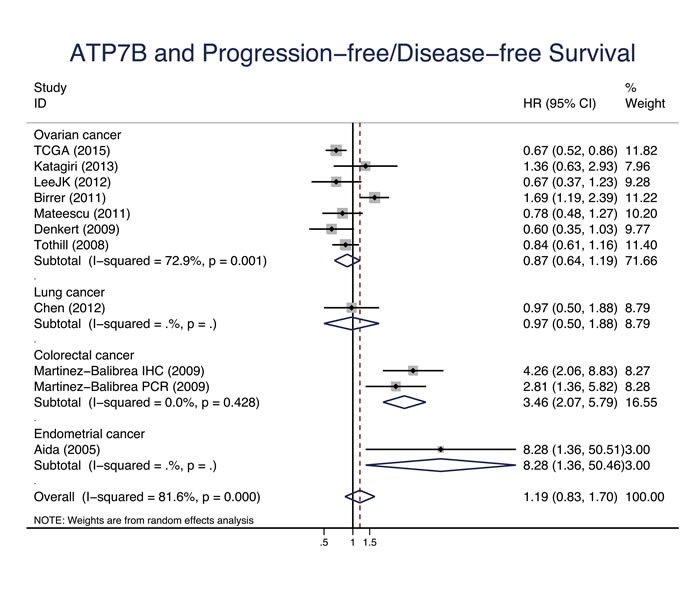
Figure 10. ATP7B and progression-free survival/disease-free survival.

Forest plot presents summary hazard ratios (HRs) and 95% confidence intervals (CIs) of correlation between ATP7B expression and progression free survival/disease-free survival (PFS/DFS in epithelial cancers.
