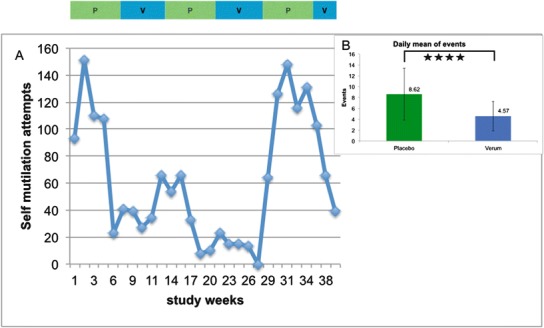
Fig. 3.

Graph illustrating the number of self-mutilation events during the SAM trial. Panel A: Events during trial periods (a bar above the graph shows placebo periods in green and SAM periods in blue). For clarity of presentation, each 50-day period is calculated as 5 parts of 10 days each. Panel B: Daily mean ± SD of self-mutilation events; green column represents placebo periods (total days, 154), and blue column represents verum period (total days, 128). The difference between the two periods was significant (p < 0.001)
