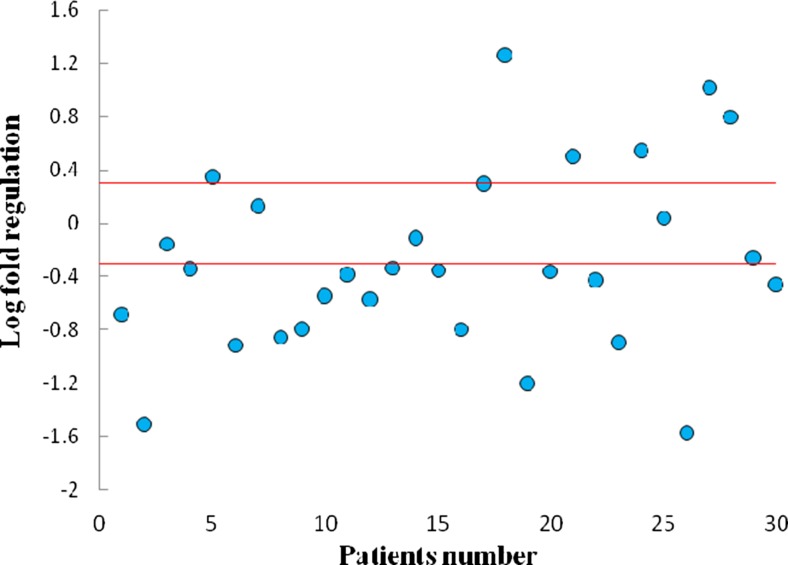
Fig. 1.
Scatter plot of FAT 4 gene expression in tumoral and non-tumoral tissues. Horizontal red lines represent cut-off values log2 fold changes in expression. The upper part of the graphs indicates up-regulation in the tumoral compared to the non-tumoral tissue; the lower part of the graph indicates down-regulation in the tumoral compared to the non-tumoral tissue (differences in expression ≥2; P < 0.05)

