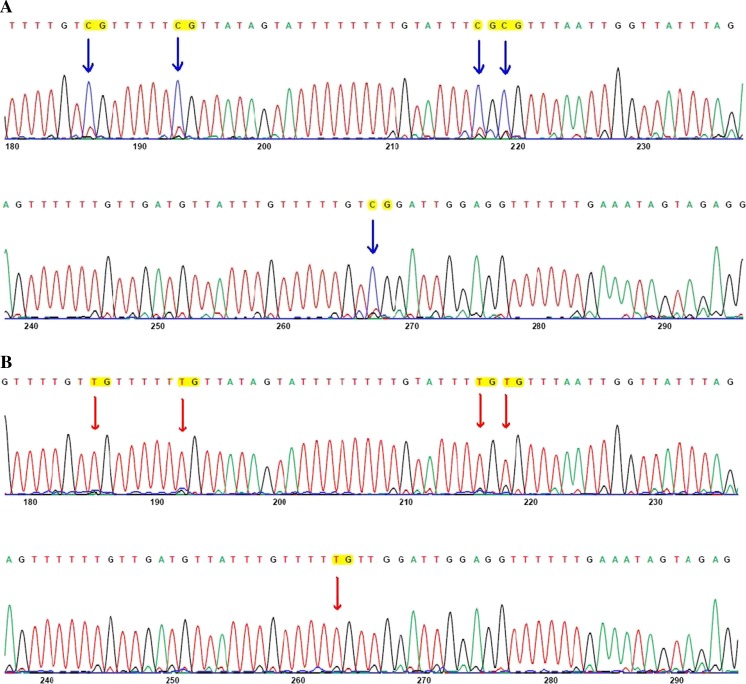
Fig. 3.
Representative electrophoregrams of FAT4 methylation pattern. These electrophoregrams represent the sequence of nucleotides −210 to −94 of FAT4 corresponding to A: a tumoral tissue and B: the non-tumoral counterpart tissue. Genomic DNA was examined after bisulfite conversion and sequencing. All cytosines were converted to thymine while methylated cytosines remained unchanged and were read as cytosine. Red arrows indicate unmethylated CpG and blue arrows indicate methylated CpG

