Figure 1.

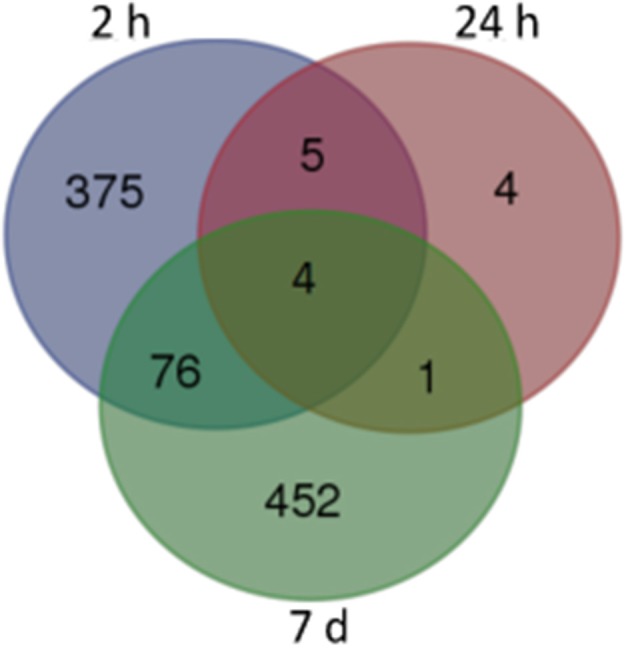
Venn map of DEGs from different withdrawal time: subsets of significant changes by Tukey's HSD comparison. The numbers within each segment indicate the number of DEGs of different withdrawal time points.

Venn map of DEGs from different withdrawal time: subsets of significant changes by Tukey's HSD comparison. The numbers within each segment indicate the number of DEGs of different withdrawal time points.