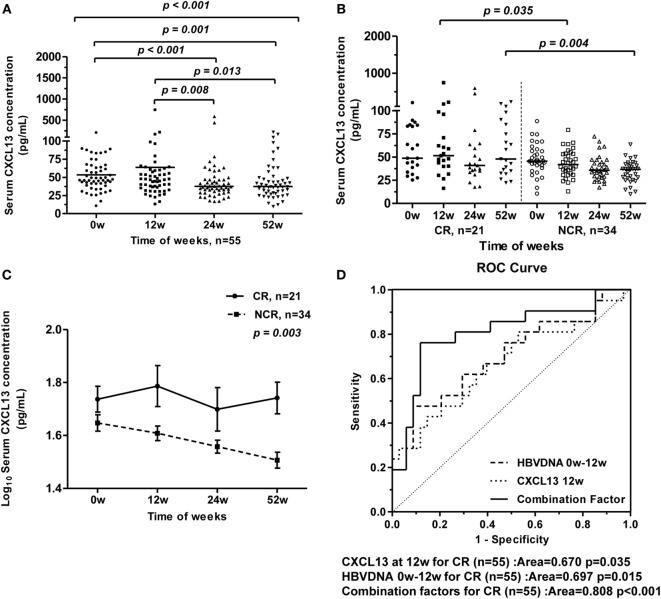
Figure 4.
Longitudinal analysis of serum CXCL13 concentrations of chronic hepatitis B (CHB) patients during telbivudine therapy. (A) Comparison of serum CXCL13 concentrations at baseline and at 12, 24, and 52 weeks after starting telbivudine therapy in all 55 hepatitis B virus e antigen-positive CHB patients. Data are representative with median, and determined by Mann–Whitney U test and Kruskal–Wallis H test. (B) Comparison of serum CXCL13 concentrations between complete response (CR) group and non-complete response (NCR) group at indicated time points. Data are representative with median, and determined by Mann–Whitney U test. (C) Repeated measures analysis of temporal dynamics of serum CXCL13 concentrations between CR group and NCR group at indicated time points. The paired Student’s t-test was used to compare individual values at different time points. (D) Receiver-operating characteristic (ROC) curves for prediction of CR after telbivudine therapy, including CXCL13 concentrations at week 12, log10 HBV DNA copies/ml of week 0 − week 12, and combination factors above.

