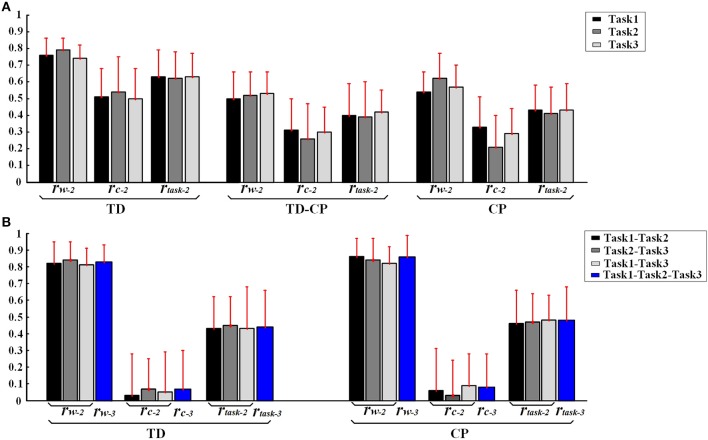
Figure 5.
(A) Inter-subject similarity coefficients (rW−2, rC−2, rtask−2.) in three task. (B) Intra-subject similarity coefficients between two tasks and Intra-subject similarity coefficients between three tasks of TD and CP groups. Error bars represent the standard deviation of synergy-related parameters.

