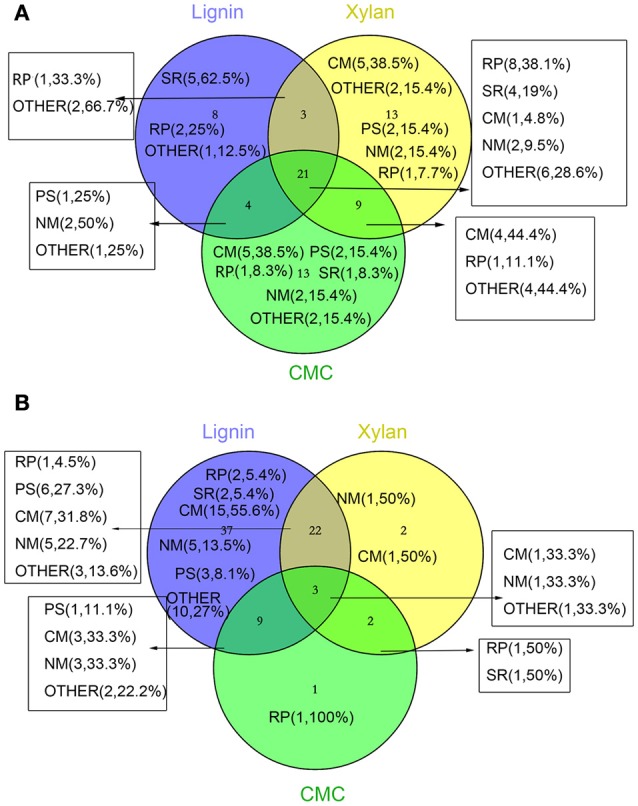
Figure 5.

Venn diagram representing the distribution of number and function of validated and significantly changed proteins according to proteome. The numbers in parentheses indicate the amount and percentage (the percentage of the proteins in increased or decreased proteins in different treatments) of protein in this section. (A) increased proteins (B) decreased proteins. Abbreviations refer to different metabolic processes: RP, redox process; NM, nucleotide metabolism; PS, protein and amino acid synthesis; SR, stress response; CM, Carbohydrate metabolism and energy metabolism; OTHER, other metabolism and unkown function.
