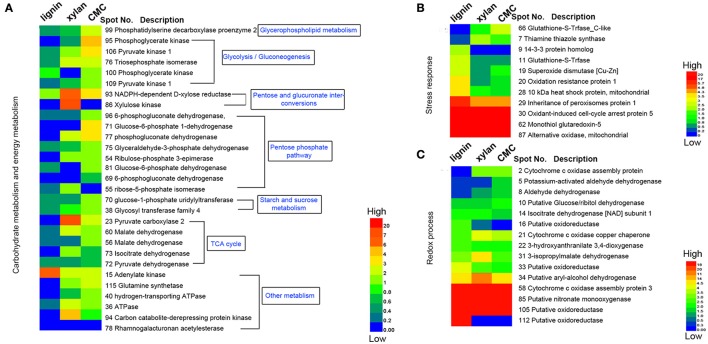
Figure 6.
Heatmap of the fold changes of differential proteins related to carbohydrate metabolism, stress response and redox process. (A) Fold change of proteins related to carbohydrate metabolism and energy metabolism. (B) Fold change of proteins response to stress. (C) Fold change of proteins related to redox process. The data are presented in matrix format in which rows represent the individual proteins and the columns represent each culture. Each cell in the matrix represents the fold change of a protein at an individual substrate compared with control. The red and green colors in cells reflect low and high change fold, respectively.

