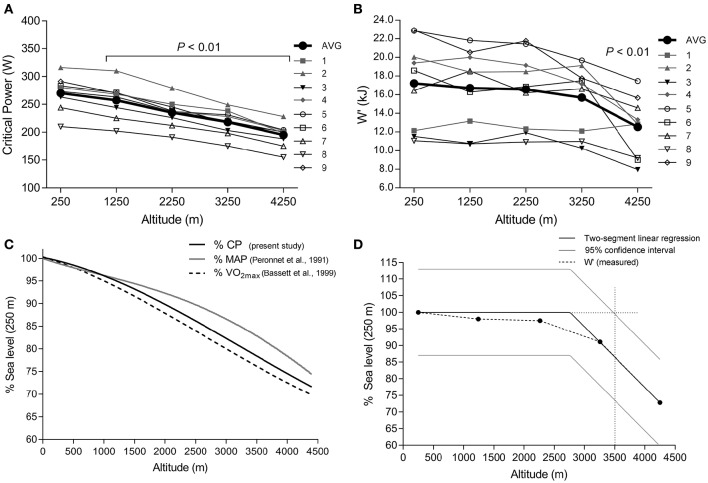
Figure 1.
Effect of increasing altitude on group mean and individual subject critical power (A) and W′ (B). Model predicted critical power also showing comparison to maximal aerobic power (MAP) and O2max (C), and W′ (D), expressed as percent of sea level measured values. In (D) light gray solid lines represent 95% CI. Intersection of the dotted lines indicates predicted altitude where a statistically significant decline in W′ would occur. P < 0.05 indicates significant difference compared to 250 m.

