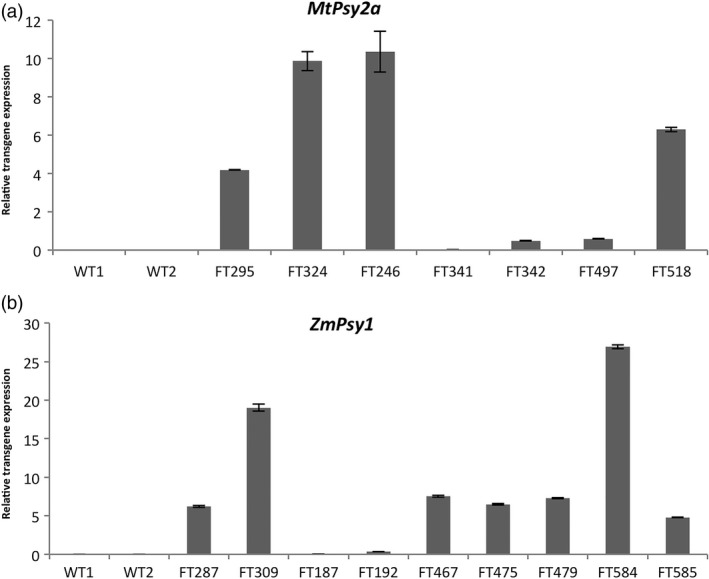
Figure 2.

Analysis of mRNA expression levels in the FG fruit pulp of selected transgenic Cavendish banana lines by qRT‐PCR. (a) MtPsy2a lines and (b) ZmPsy1 lines. FG, full green. WT, wild‐type with WT1 = FT167 and WT2 = FT430. Values are normalized expression levels ± SEM.
