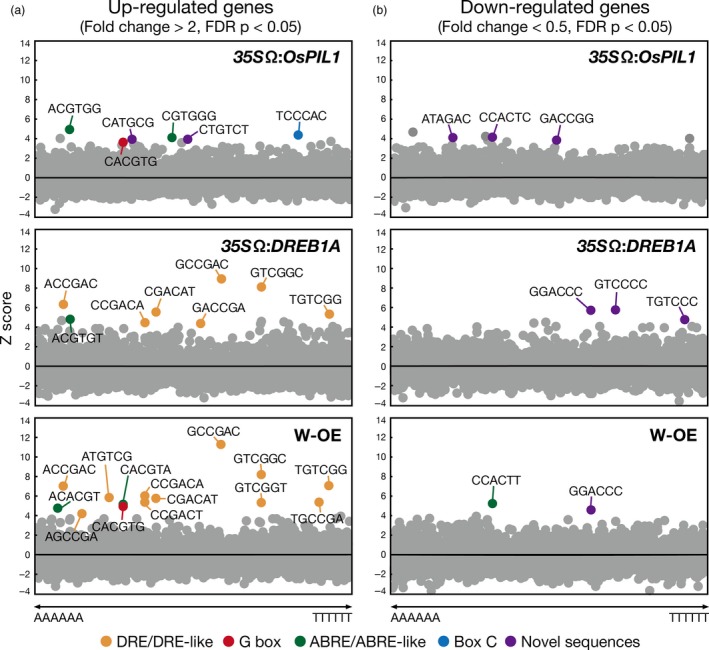
Figure 6.

Overrepresentation analyses of hexamer sequences in the promoters of up‐regulated and down‐regulated genes in the single or double overexpressors. Scatter plots showing Z scores (y‐axes) for the observed frequencies of all hexamer sequences (x‐axes) in the 1‐kb promoters of up‐regulated (a) and down‐regulated genes (b) in each transgenic plant. DRE/DRE‐like (orange), G box (red), ABRE/ABRE‐like (green), Box C (blue) and novel sequences (purple) are shown.
