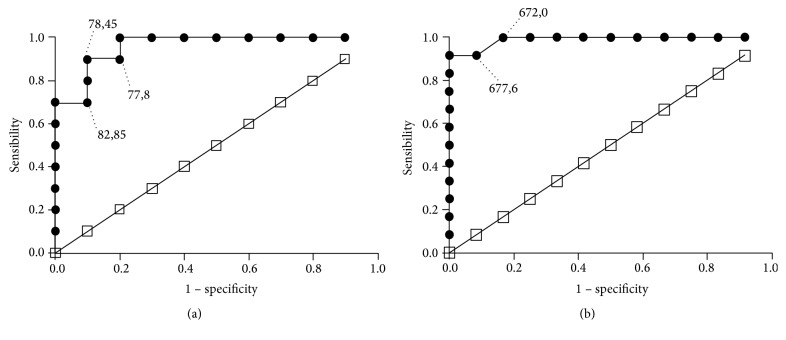
Figure 3.
Receiver-operator-characteristic (ROC) curve for the chemokine CCL2 (a) and the regulatory cytokine IL-10 (b) in diagnostic of experimental cardiac inflammation. The ROC curve was assessed for various concentrations of CCL2 and IL-10 in T. cruzi infected C57BL/6 mice, under carvedilol treatment or not, during the diagnosis of inflammatory heart disease (CCL2, area under the ROC curve: 0.960 and p < 0.0005 and IL-10 area under the ROC curve: 0.989 and p < 0.0005).

