FIGURE 3.

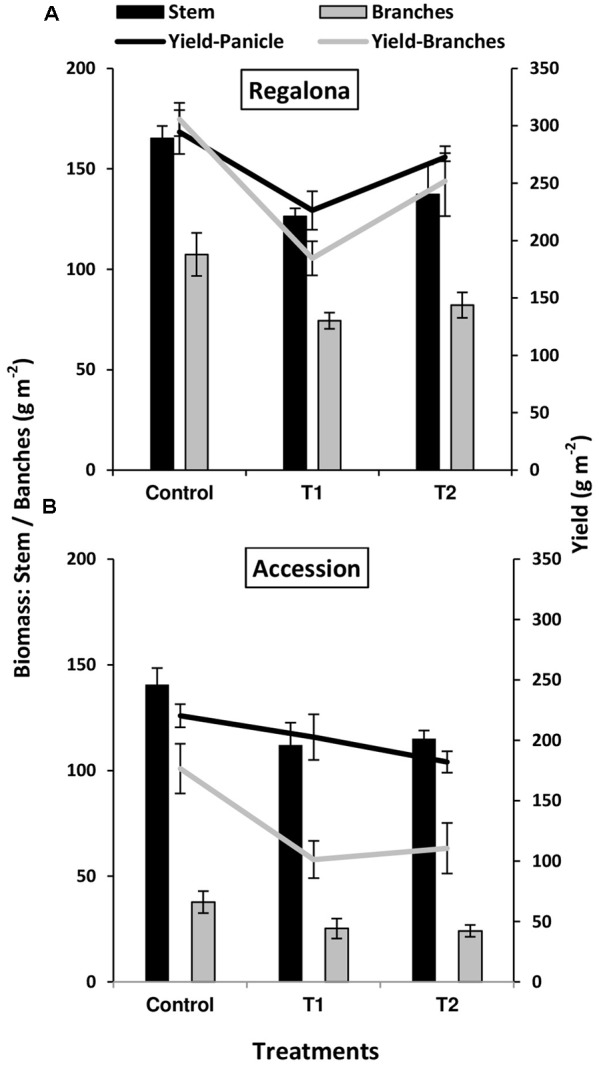
Grain yield (lines) and biomass (bars) of main stem (black) and branches (gray) of control and heating treatments (T1 and T2) in Regalona (A), Accession (B). Bars show the SE of the means.

Grain yield (lines) and biomass (bars) of main stem (black) and branches (gray) of control and heating treatments (T1 and T2) in Regalona (A), Accession (B). Bars show the SE of the means.