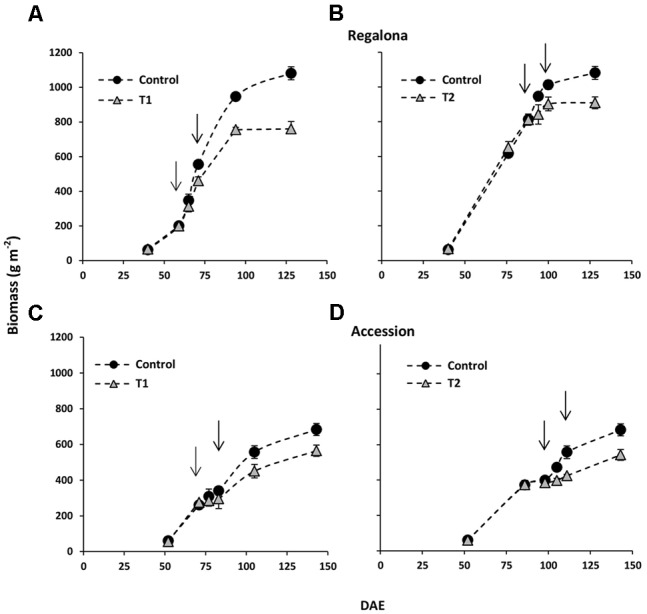
FIGURE 4.

Time-course of above-ground biomass offor control and T1 (A) and T2 (B) treatments in cv. Regalona (A,B) and Accession (C,D) days after emergence (DAE). Arrows indicate the beginning and the end of heat treatments. Bars show the SE of the means.
