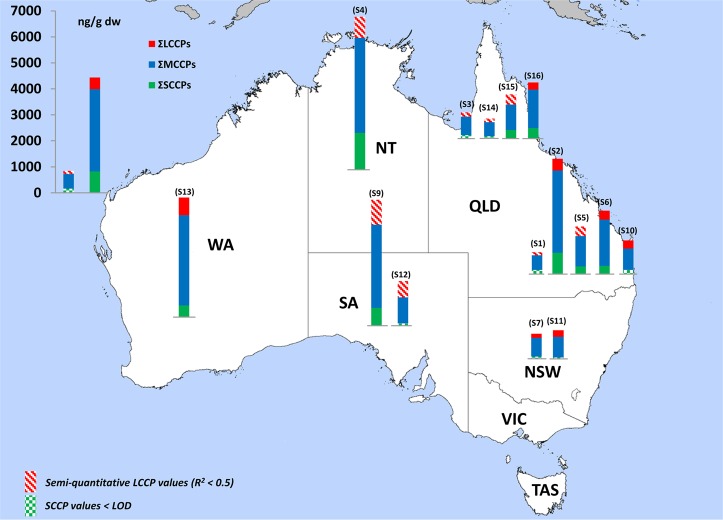
Figure 1.
Total CP concentrations in ng/g dry weight measured in the sewage sludge samples from Australia. The LCCP values with an R2 lower than 0.5 are highlighted with red stripes and are semiquantitative values. The SCCP values lower that the LOD are highlighted with green blocks. (WA = Western Australia; NT = Northern Australia; SA = South Australia; QLD = Queensland; NSW = New South Wales; VIC = Victoria; TAS = Tasmania.

