Figure 4.
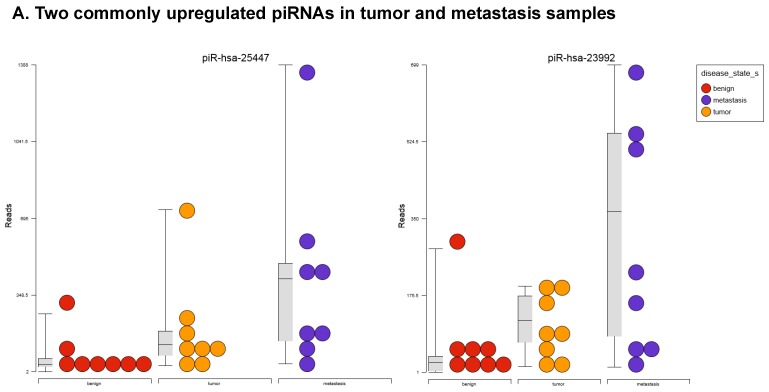
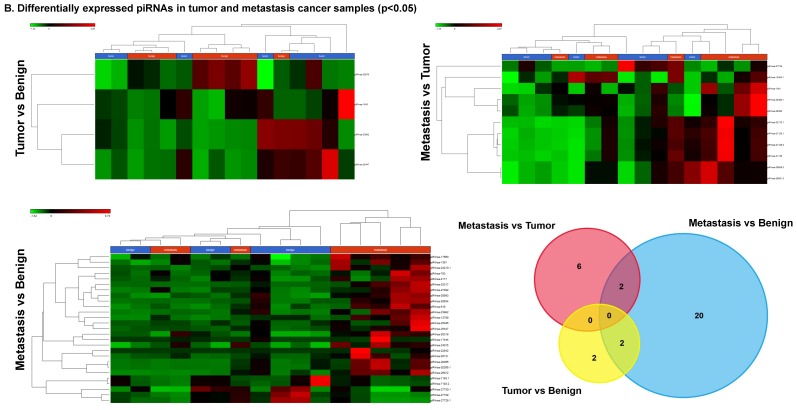
Differential expression of piRNAs in colorectal cancer: piRNA analysis revealed a total of two piRNAs statistically regulated commonly between two groups. They are (Figure 4A) listed as dot plots. A dendrogram view of all statistically significant piRNAs (p≤0.05) are shown as hierarchical clustering and along with a Venn diagram (Figure 4B).


