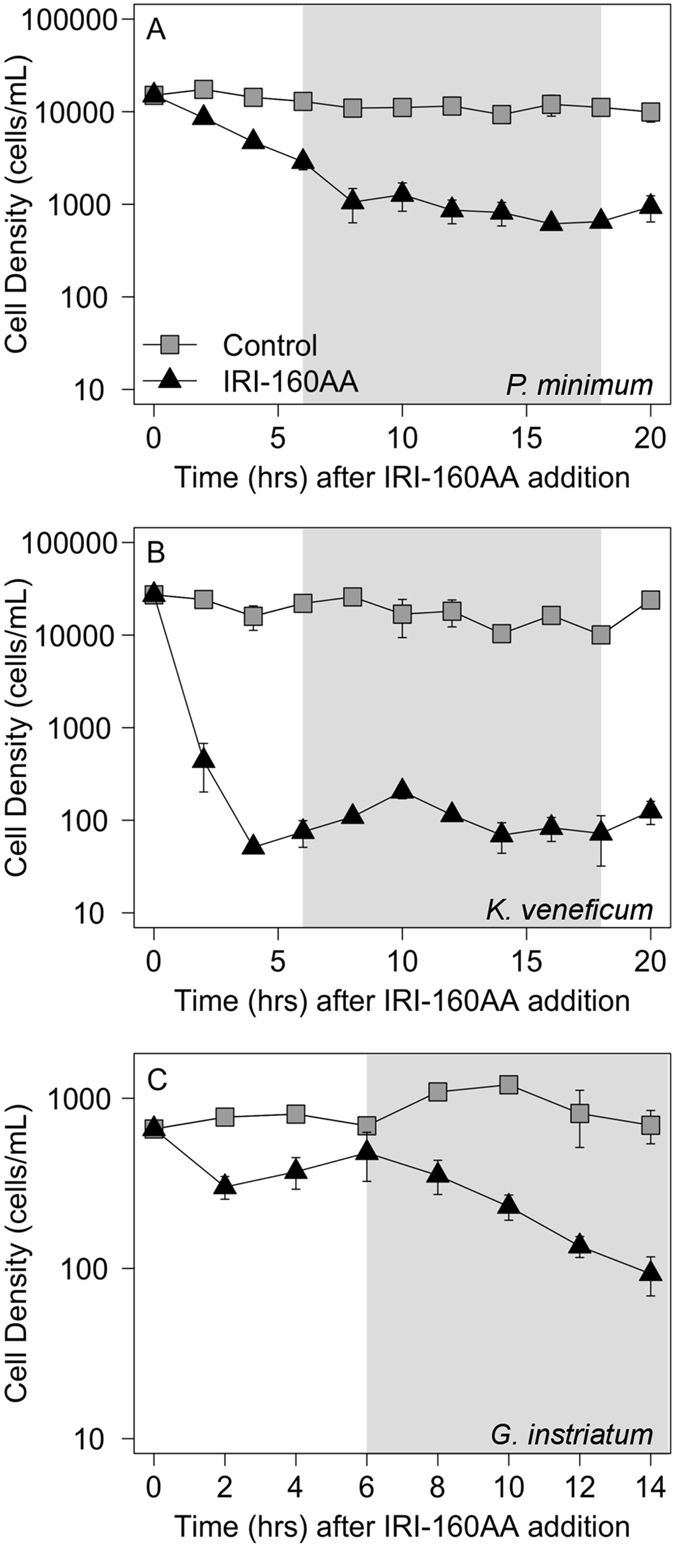
Figure 1. Cell density in dinoflagellate cultures after exposure to IRI-160AA.

(A) P. minimum, (B) K. veneficum and (C) G. instriatum after the addition of 10% (v/v) f/2 (gray squares) or IRI-160AA (black triangles). Points represent the average of triplicates measured every 2 hours for 14 hours (G. instriatum) or 22 hours (P. minimum and K. veneficum). Error bars are one standard deviation of the mean for each point (n = 3). The light gray rectangle identifies the light/dark transition.
