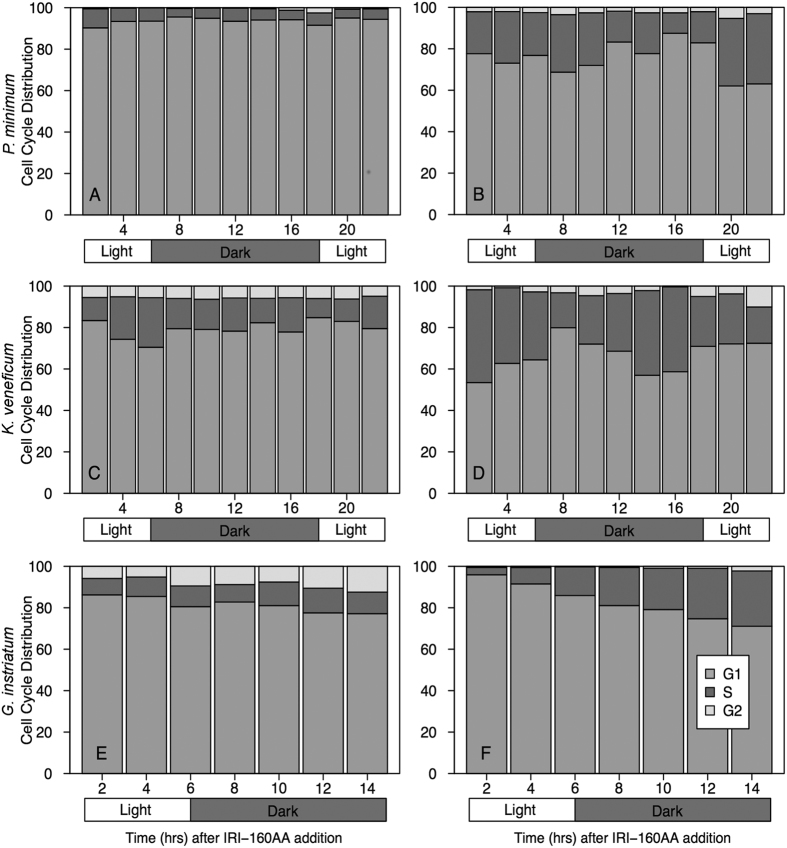
Figure 2. Cell cycle analyses for all three dinoflagellates.
The percentage of cells in each phase at each time point for P. minimum (A,B), K. veneficum (C,D) and G. instriatum (E,F) after a 10% (v/v) f/2 medium (A,C,E) or IRI-160AA (B,D,F) treatment. Phases were distinguished using the Watson Model and partitioned into G1 (gray), S (dark gray), and G2/M (light gray). Bars represent concatenated triplicates at 2 hour time intervals. Rectangles under each panel indicate the light/dark transition for reference.

