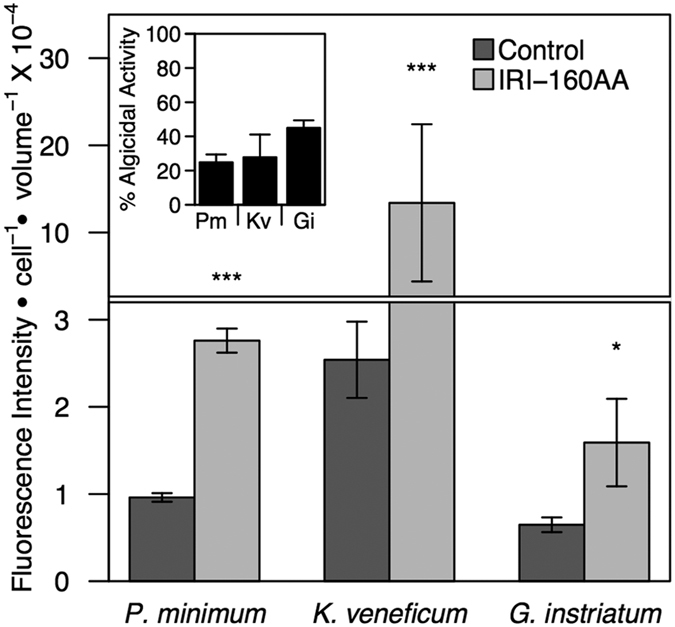
Figure 4. Endogenous ROS production.

ROS production after addition of algicide IRI-160AA to P. minimum, K. veneficum and G. instriatum. Bars represent the mean (n = 3) fluorescence intensity per cell by volume (bio-volume) for controls (dark gray) and algicide treatments (light gray). Error bars represent +/−1 standard deviation. Significant differences between controls and algicide treatments for each species are indicated by asterisks: *p < 0.05; **p < 0.01; ***p < 0.001. The horizontal line represents an axis break. The inset figure represents algicidal activity associated with the endogenous ROS experiment at 3 hours incubation with IRI-160AA.
