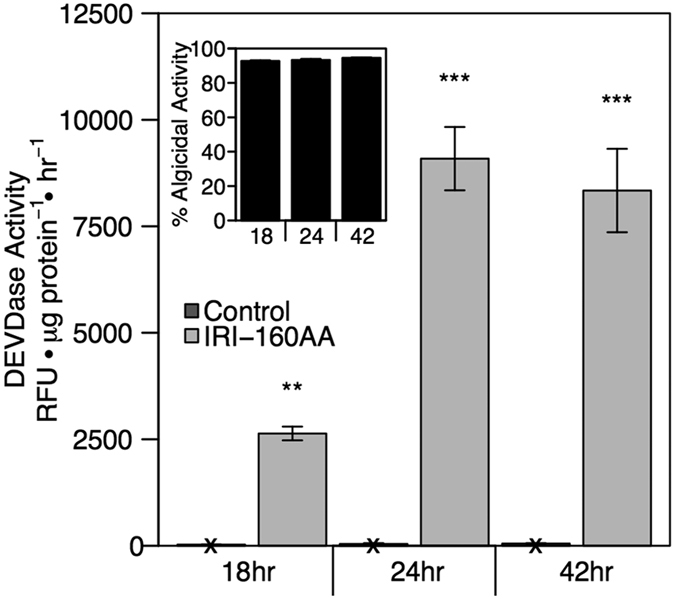
Figure 6. DEVDase enzyme activity: time series.

DEVDase activity after addition of algicide IRI-160AA to G. instriatum after 18, 24 and 42 hours exposure. Relative activity was normalized to protein content. Bars represent triplicate means of the DEVDase activity expressed as relative fluorescence units per hour per μg of total protein in the control (dark gray) and algicide treatments (light gray). Error bars represent one standard deviation of the mean (n = 3). Significant differences between and treatments are indicated by asterisks: *p < 0.05; **p < 0.01; ***p < 0.001. An X on controls bars indicates little to no DEVDase activity. The inset figure represents algicidal activity accompanying the DEVDase experiment. For inset: error bars show one standard deviation of the mean (n = 3).
