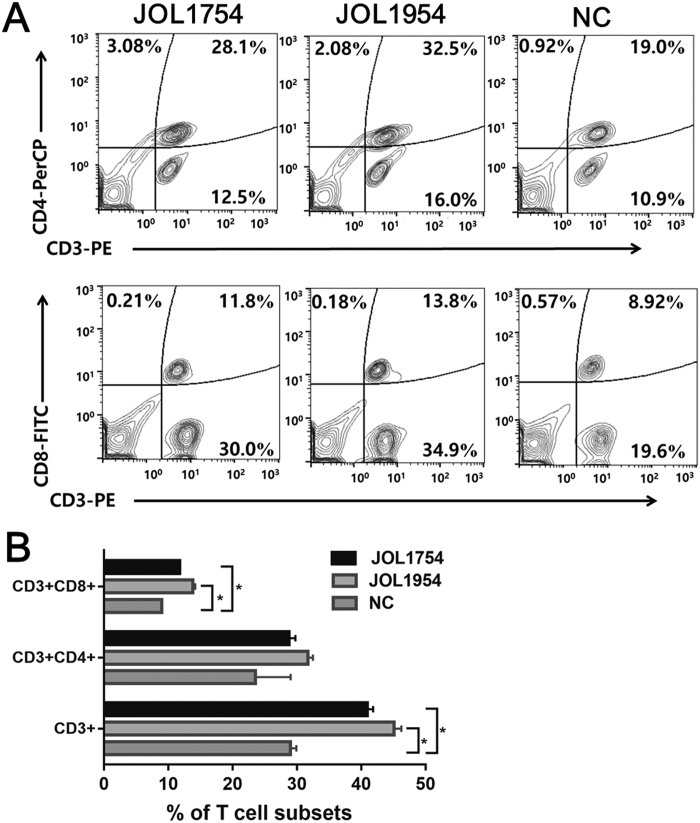
Figure 9. Flow cytometric analysis for CD3+CD4+ splenic T lymphocyte population.
(A) Representative flow cytometry scatter dot plots for CD3+, CD3+CD4+, CD3+CD8+ splenic T cell populations of immunized mice (n = 5) and the negative controls (NC) (n = 5). The subpopulations are expressed as a percentage of the gated cells. II) CD3+, CD3+CD4+ and CD3+CD8+ splenic T-cell subsets in immunized mice and NC. The data are presented as the mean ± s.d. *P < 0.05 when the values are compared with the negative control group.

