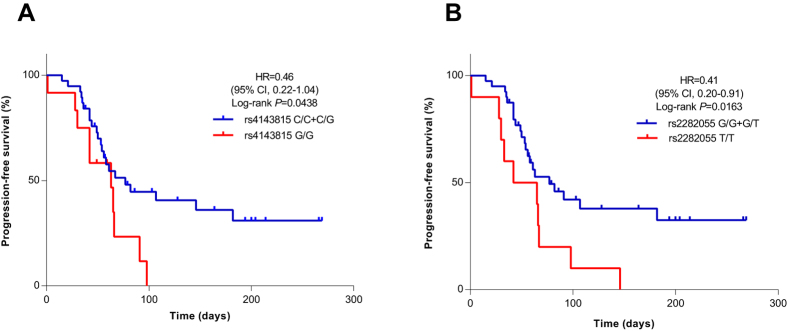
Figure 1.
Kaplan-Meier curves of PFS after administration of nivolumab, stratified by the genotype PD-L1 rs4143815 (A) and rs2282055 (B). Symbols denote censored observations. The differences between the groups were evaluated using the log-rank test. Multivariate Cox proportional hazards models were used to estimate adjusted hazard ratios (HR) with 95% confidence intervals.

