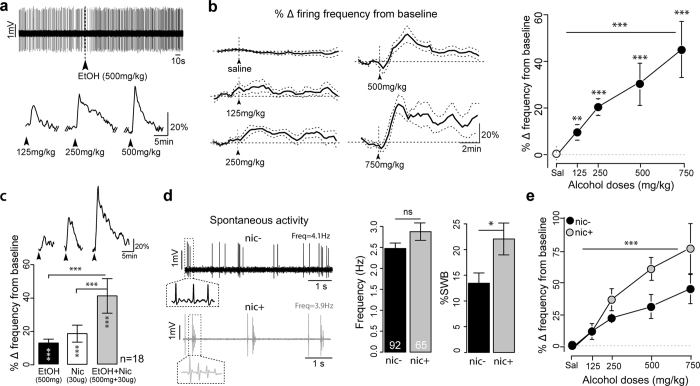
Figure 1. Acute and chronic nicotine enhance alcohol responses of VTA DA neurons.
(a) (top) Typical electrophysiological recording showing the increase in firing rate of VTA DA cell induced by 500 mg/kg i.v. alcohol injection in WT mice. (bottom) Example responses of a VTA DA neuron to consecutive doses of alcohol. Arrowheads indicate the time of the injection. (b) (left) Mean ± SEM DA cell firing frequency modification after injection of saline and the indicated ethanol dose (saline, n = 28; 125 mg/kg, n = 13; 250 mg/kg, n = 14; 500 mg/kg, n = 14; 750 mg/kg, n = 7). Arrowheads indicate the time of the injection. (right) Dose-response curve of ethanol-elicited responses for the same groups of neurons. ***p < 0.001, **p < 0.01, Wilcoxon paired test from baseline. Horizontal lines indicate significant dose effect (one-way ANOVA). (c) (top) Example responses of a VTA DA neuron to consecutive injections of alcohol, nicotine and combined alcohol + nicotine. Arrowheads indicate the time of the injections. (bottom) Barplot of the maximum of firing frequency variation from baseline (mean ± SEM) after alcohol (black), nicotine (white), or combined alcohol + nicotine injections (gray). ***p < 0.001, Wilcoxon paired test from baseline is indicated within each vertical bar. Difference between groups is indicated above the horizontal lines. ***p < 0.001, Wilcoxon paired test between groups. (d) (left) Examples of electrophysiological recordings of the basal activity of a DA neuron of a nic− (black) and a nic+ (gray) mouse. Insets: Enlarged views of two or more action potentials. (right) Barplot of the mean frequency and %SWB for nic− (black, n = 92) and nic+ mice (gray, n = 65). *p < 0.05, Wilcoxon test. (e) Dose-response curve of ethanol-elicited DA cell responses for nic− (black) and nic+ (gray) mice. Mean ± SEM of variation from baseline in firing frequency. Horizontal lines indicate significant dose effect and vertical lines indicate treatment effect (***p < 0.001, *p < 0.5, two-way ANOVA. Nic−: saline: n = 36; 125 mg/kg: n = 19; 250 mg/kg: n = 22; 500 mg/kg: n = 17; 750 mg/kg: n = 9; nic+: saline: n = 19; 125 mg/kg: n = 3; 250 mg/kg: n = 9; 500 mg/kg: n = 9; 750 mg/kg: n = 12).

