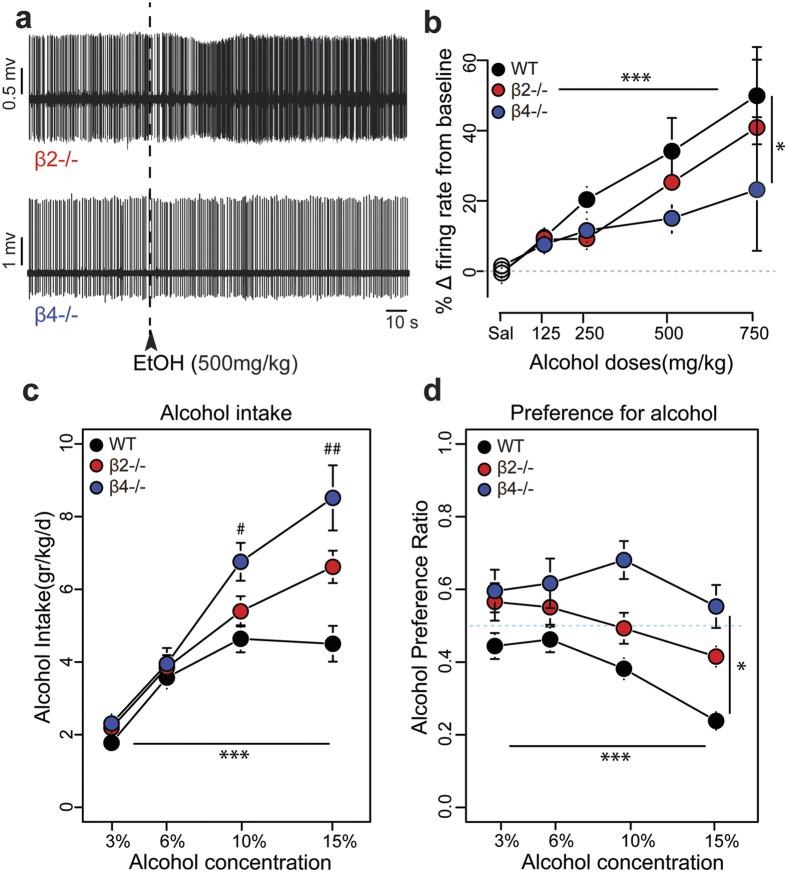
Figure 3. Alcohol-induced responses and alcohol reward are modified in β4−/−, but not in β2−/− mice.
(a) Typical electrophysiological recordings showing the increase in firing rate of VTA DA cells induced by 500 mg/kg i.v. alcohol injection in β2−/− (top) and β4−/− mice (bottom). (b) Dose- response curves of ethanol-elicited DA cell responses for WT (black), β2−/− (red) and β4−/− mice (blue). Horizontal lines indicate significant dose effect and vertical lines indicate strain effect. ***p < 0.001, *p < 0.5, two-way ANOVA (see Results section for statistical details). WT: saline: n = 28; 125 mg/kg: n = 13; 250 mg/kg: n = 14; 500 mg/kg: n = 14; 750 mg/kg: n = 7; β2−/−: saline: n = 15; 125 mg/kg: n = 5; 250 mg/kg: n = 10; 500 mg/kg: n = 11; 750 mg/kg: n = 8; β4−/−: saline: n = 23; 125 mg/kg: n = 9; 250 mg/kg: n = 10; 500 mg/kg: n = 14; 750 mg/kg: n = 7. (c) Mean ± SEM of ethanol intake (gr/kg) in WT (black, n = 18), β2−/− (red, n = 9) and β4−/− mice (blue, n = 6) during the two bottle choice procedure. ***p < 0.001, repeated measures two-way ANOVA; ##p < 0.01, #p < 0.05, multiple comparisons with Bonferroni correction. (d) Mean ± SEM of the preference ratio for alcohol over total fluid intake for the same groups of mice. ***p < 0.001; *p < 0.05, repeated measures two-way ANOVA (see Results section for statistical details).

