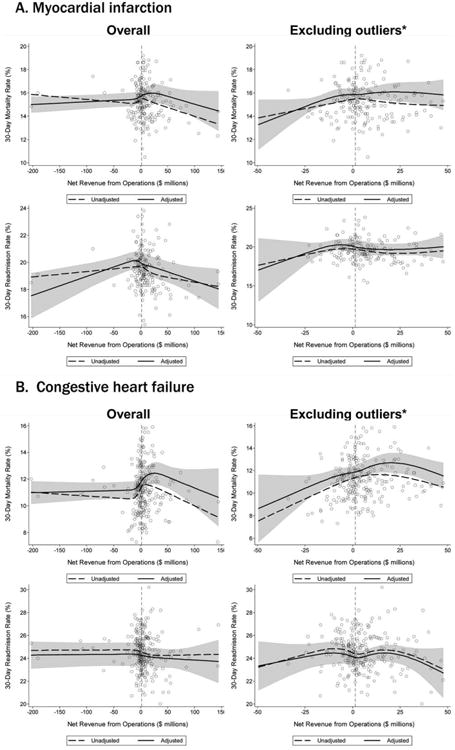
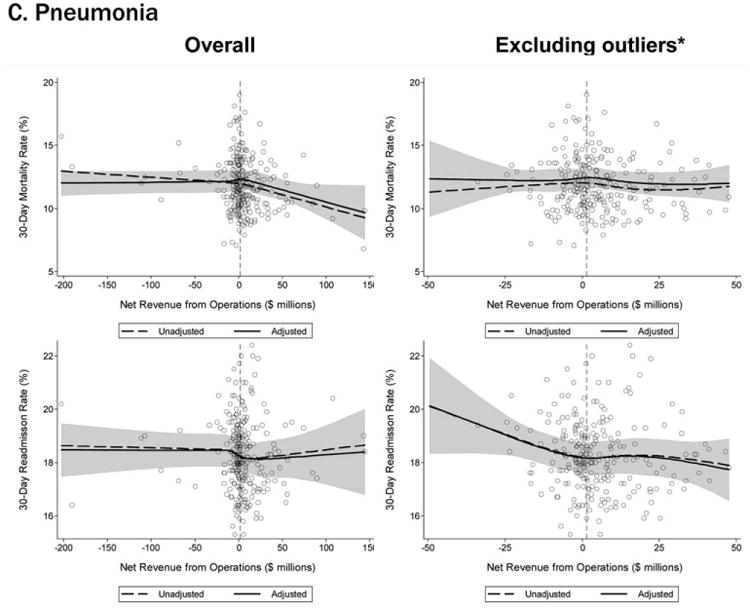
Fig. 1.


Relationship between financial performance and 30-day readmission and mortality. The open circles represent individual hospitals. The bold dashed line and the bold solid line are the unadjusted and adjusted cubic spline curves, respectively, representing the nonlinear relationship between net revenue from operations and each outcome. The shaded grey area represents the 95% confidence interval for the adjusted cubic spline curve. Thin vertical dashed lines represent median values for net revenue from operations. Multivariate models were adjusted for teaching status, metropolitan status (urban vs rural), bed size, safety-net hospital status, hospital ownership, Medicare caseload, and volume of cases reported for the respective outcome, accounting for clustering of hospitals by owner. *Twenty-three hospitals were identified as outliers with respect to net revenue from clinical operations (10 “underperformers” with net revenue <−$49.4 million and 13 “overperformers” with net revenue >$52.1 million.
