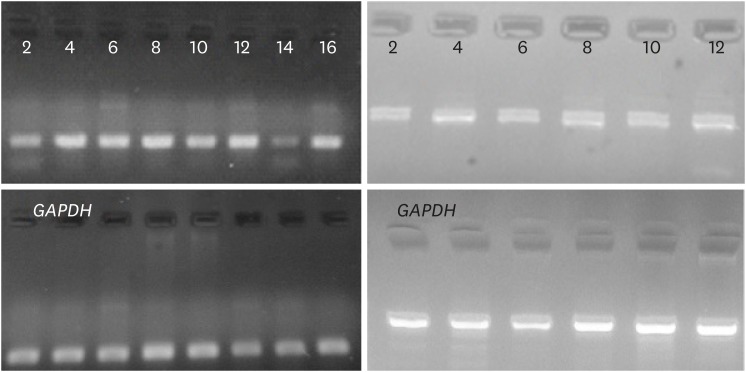
Fig. 3.
G3BP1 and GAPDH real-time PCR products were loaded in upper and lower lane, respectively. The results obtained after GelQuantNET software (BiochemLabSolutions, San Francisco, CA, USA) and GraphPad Prism 5 analysis (GraphPad Software, Inc., La Jolla, CA, USA), suggest no significant correlation between the G3BP1 expression and disease progression (P-value, 0.0886), while VEZT expression was found to be significantly correlated (P-value, 0.0175).
PCR = polymerase chain reaction.

