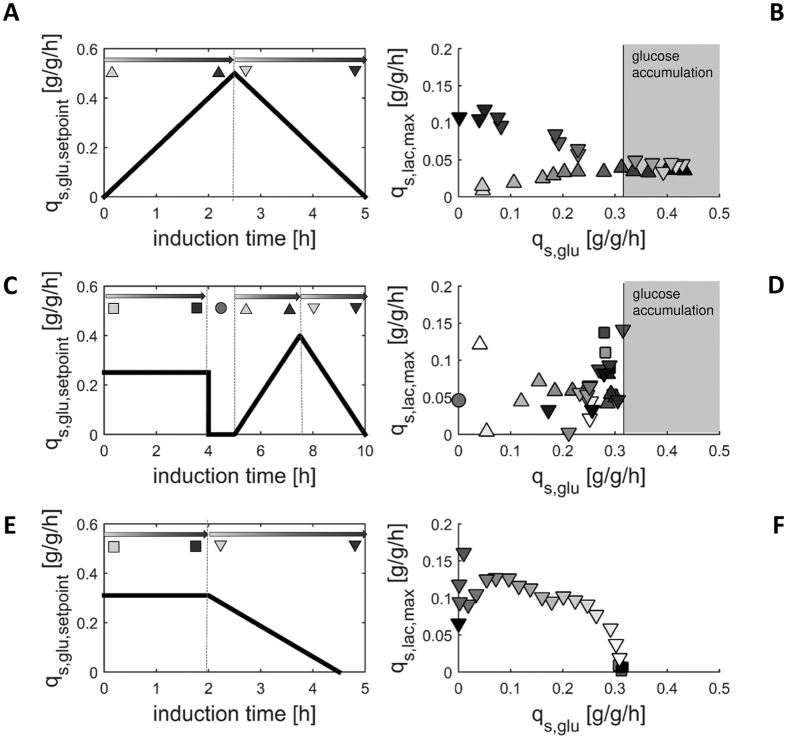
Figure 2.
Dynamic bioprocess strategies (A,C,E) and respective resulting qs,glu/qs,lac,max-correlations (B,D,F) for the pET-based recombinant E. coli BL21(DE3) strain producing the tandem scFv against celiac disease. Different feeding phases are marked by different symbols. Time courses within phases go from light grey to dark grey, as indicated on the left. The shape and colour of the symbols of the qs,glu/qs,lac,max data points on the right (B,D,F) correspond to the symbols on the left (A,C,E). Samples were taken every hour during adaptation, every 10 min during qs,glu ramps and every hour after the ramp. For clear data representation error bars were omitted. The error was always between 7% and 15%.

