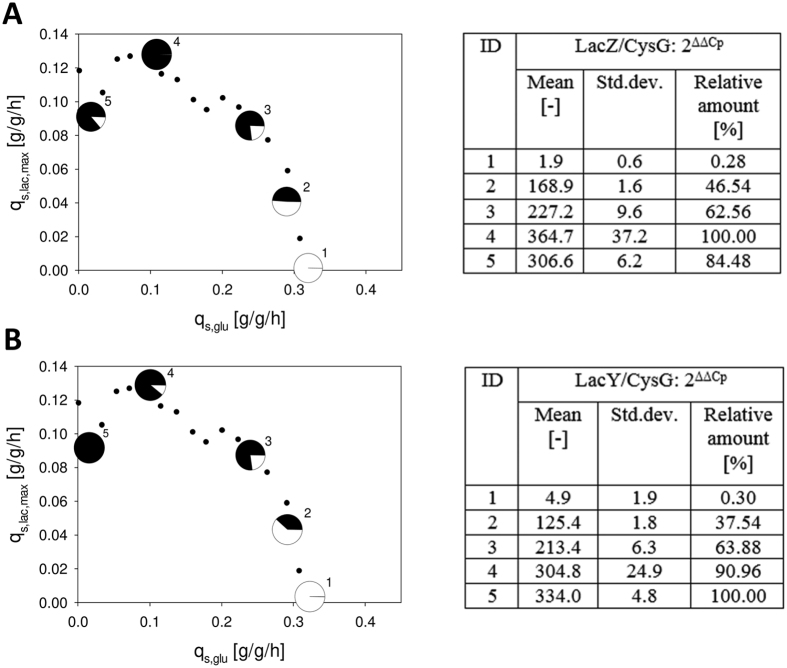
Figure 5.
Time course of transcription of lacZ (A) and lacY (B). qPCR data were referenced to CysG. 2ΔΔCp values were calculated by relating ΔCp to a reference sample which was taken before induction. Pie charts display the percentage of transcription in relation to the highest 2ΔΔCp value obtained.

