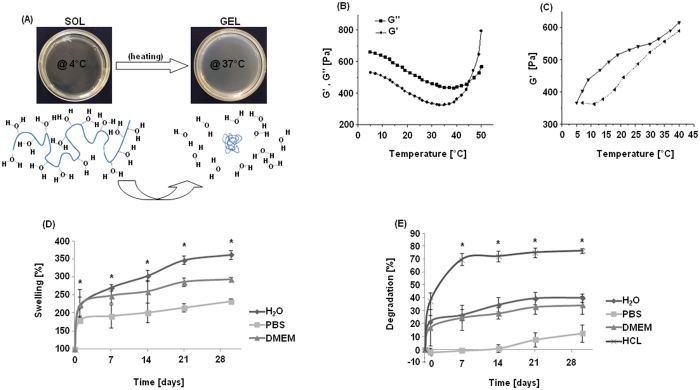
Figure 2.
Representative pictures of MC hydrogel sol and gel phases (A, upper panel) and schematic representation of physical transition (A, lower panel, MC in blue). Shear storage modulus (G′, round dots) and shear loss modulus (G″, square dots) versus temperature (B). Thermo-reversible behavior of the MC hydrogel increasing (straight line) and decreasing (dot line) the temperature (C). Percent swelling of MC hydrogel versus incubation time (D); at each time point a statistical difference between day and day (1-7-15-21-30) was detected, while the asterisk (*) represents a significant difference between water and media (p < 0.05). Gel degradation rates are reported in (E): asterisk (*) indicates a significant difference (p < 0.05) between acid (HCl, positive control) and other incubation environments.

