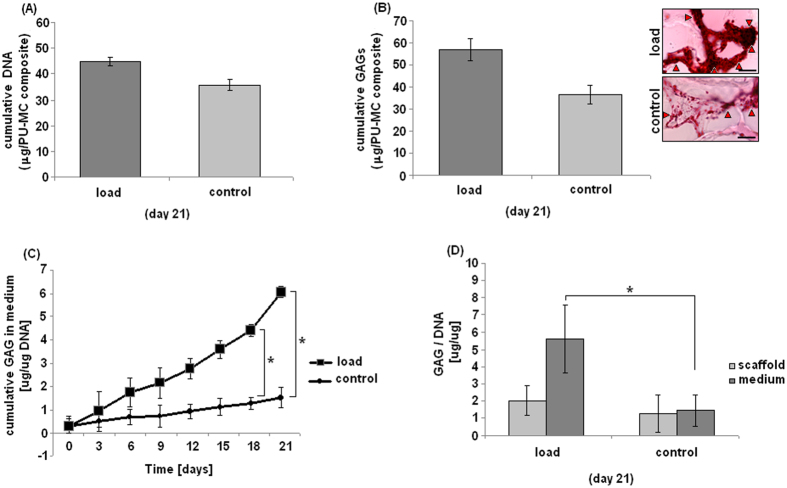
Figure 5. GAG evaluation.
After 21 days loading the number of cells in the loaded and control specimens was comparable as they showed a similar DNA amount (A, p > 0.05). The GAG/scaffold amount was higher for the loaded ones, but not in a statistical manner in comparison with controls (B, p > 0.05, lower panel). Differences were also appreciable by safranin-O staining as shown in (B), upper panel. Conversely, accumulated GAG released in the medium over 3 weeks of culture normalized to the DNA content of respective samples (C) showed significant results over the loading period of 18 days (p < 0.05, indicated by the asterisk). After 21 days the scaffold GAG amount was determined and the GAG amount of medium and scaffold compared between load and control (D). The total GAG amount was significantly different between loaded and control samples (p < 0.05, indicated by the asterisk). Bar scale = 100 μm, (magnification 40x).

