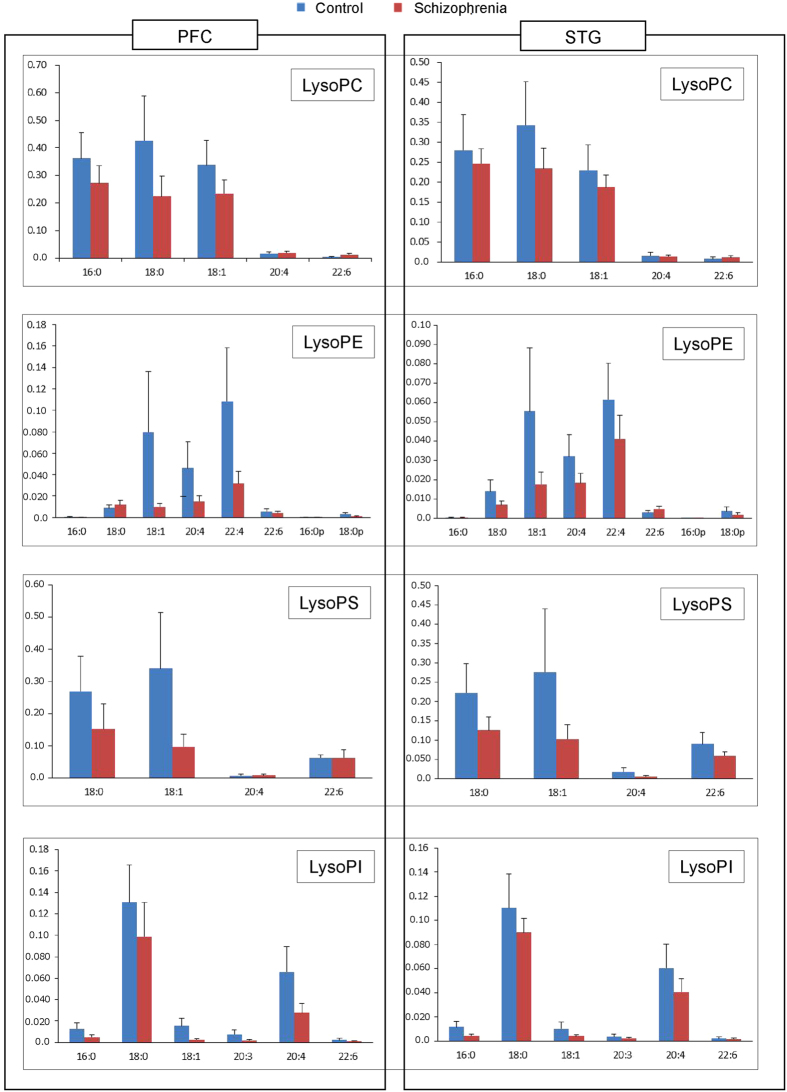
Figure 2. Quantification and analysis of lysophospholipids in brain tissue samples.
The amounts of lysophosphatidylcholine (LysoPC), lysophosphatidylethanolamine (LysoPE), lysophosphatidylserine (LysoPS), and lysophosphatidylinositol (LysoPI) in the prefrontal cortex (PFC) and superior temporal gyrus (STG) are presented in the bar charts, such that the y-axis indicates the relative intensity of each phospholipid as quantified by LC-ESI/MS/MS in the PFC and the STG gray matter. The leftmost charts indicate the relative intensity of PFC gray matter, and the rightmost charts represent relative intensity of the STG.

