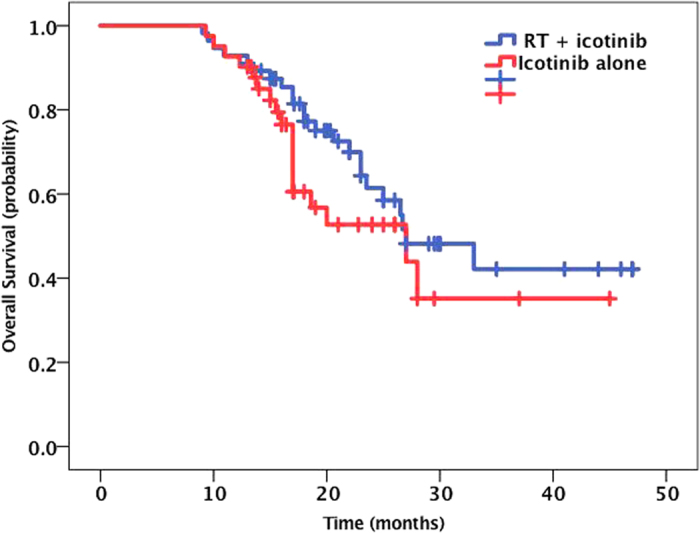
Figure 2. The Kaplan-Meier curve for OS between RT + icotinib group and icotinib alone group.

The patients in the RT combined with icotinib group showed a longer OS (median time, 31.9 months) than the patients in the icotinib alone group (median time, 27.9 months), but with no statistically significance (P = 0.237).
